AFP sensing & experiments
Temperature-recording experiments, a custom thermocouple carrier, and a multisensor monitoring dashboard.
COMPOSITE MANUFACTURING · EXPERIMENTS · INSTRUMENTATION
This project characterizes surface heating during automated fiber placement (AFP) and develops instrumentation for recording and monitoring process conditions. Temperature varies with sensor position, exposure time, and surface material, so evaluating the heating process requires spatially resolved measurements and a consistent path from sensors to recorded data.
I participated in the temperature-recording experiments for the team’s AFP thermal study. My subsequent instrumentation work includes the thermocouple carrier PCB, microcontroller firmware, acquisition interfaces, and monitoring software described below. The experimental measurements and later acquisition system represent distinct stages of this work; the thermal models were developed by other members of the team.
Experiments Hardware Dashboard
1. Temperature-recording experiments
1.1 Experimental setup and procedure
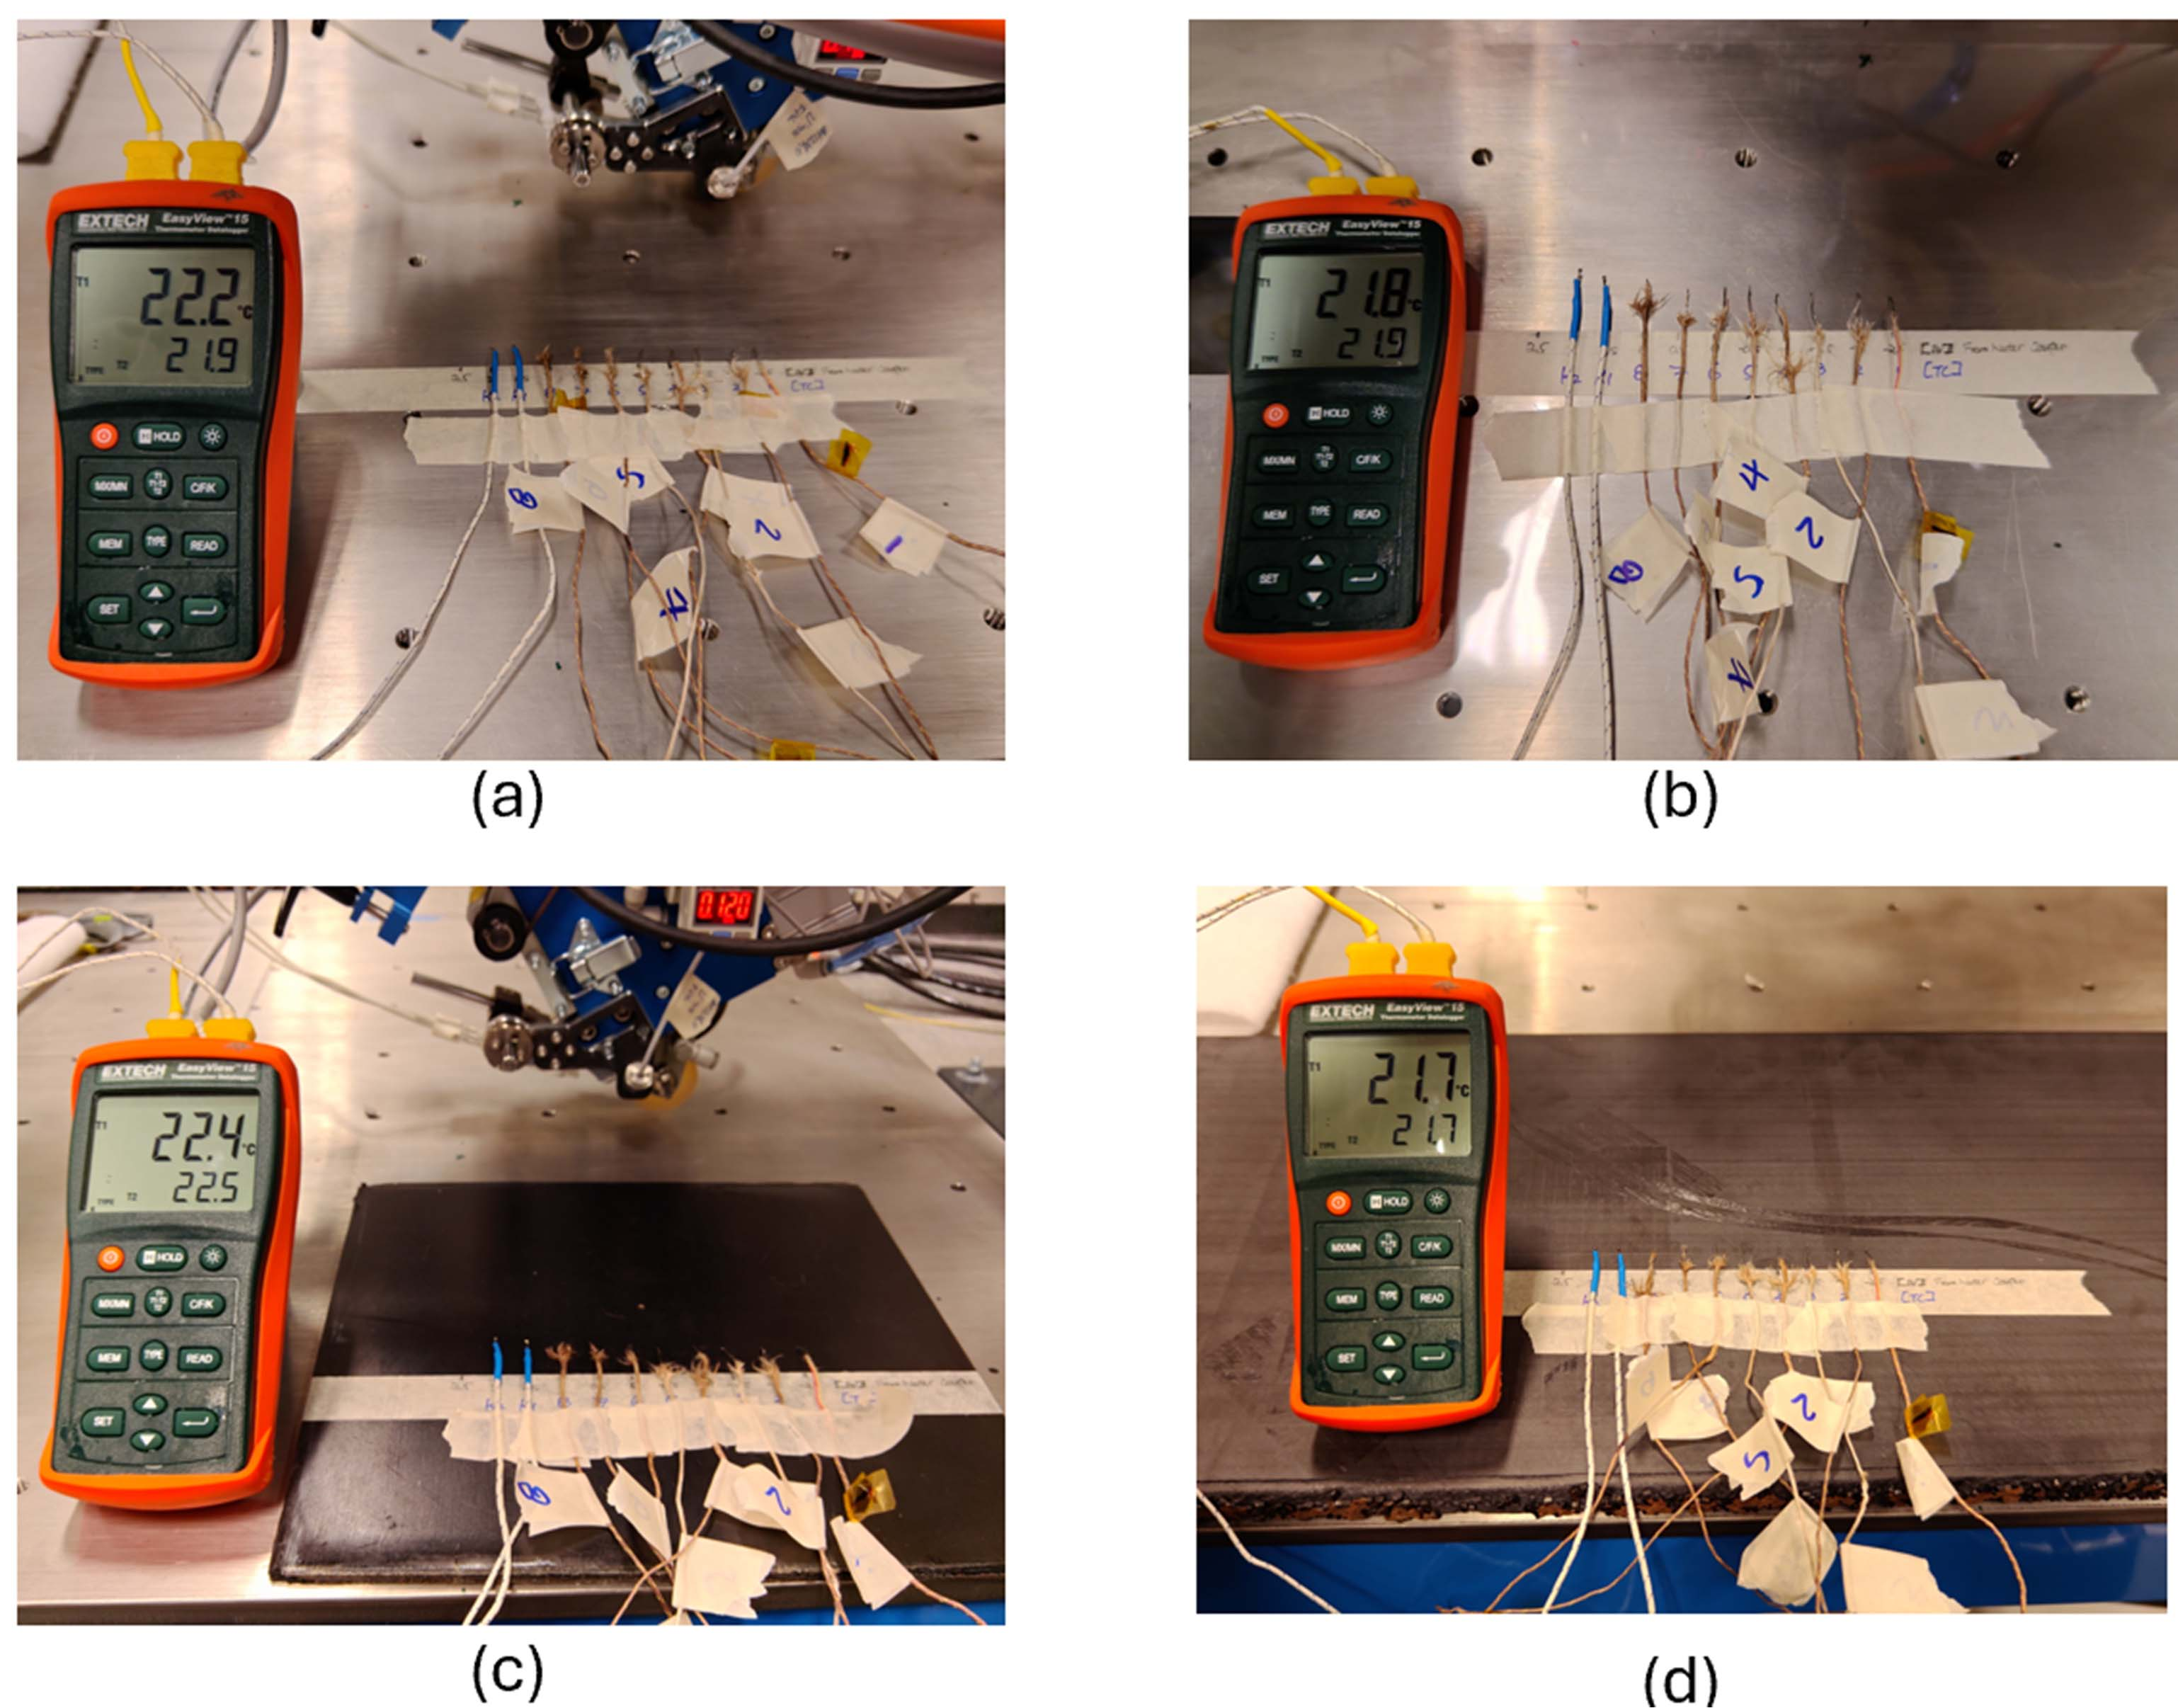
The experimental setup used a 600 W infrared heater and ten thermocouples at 0.5 in spacing along the heating/travel direction. Four surfaces were tested: the metal machine table, a Mylar sheet over metal, a TC910/PA6 compacted plate, and an additively manufactured PPS-CF surface.
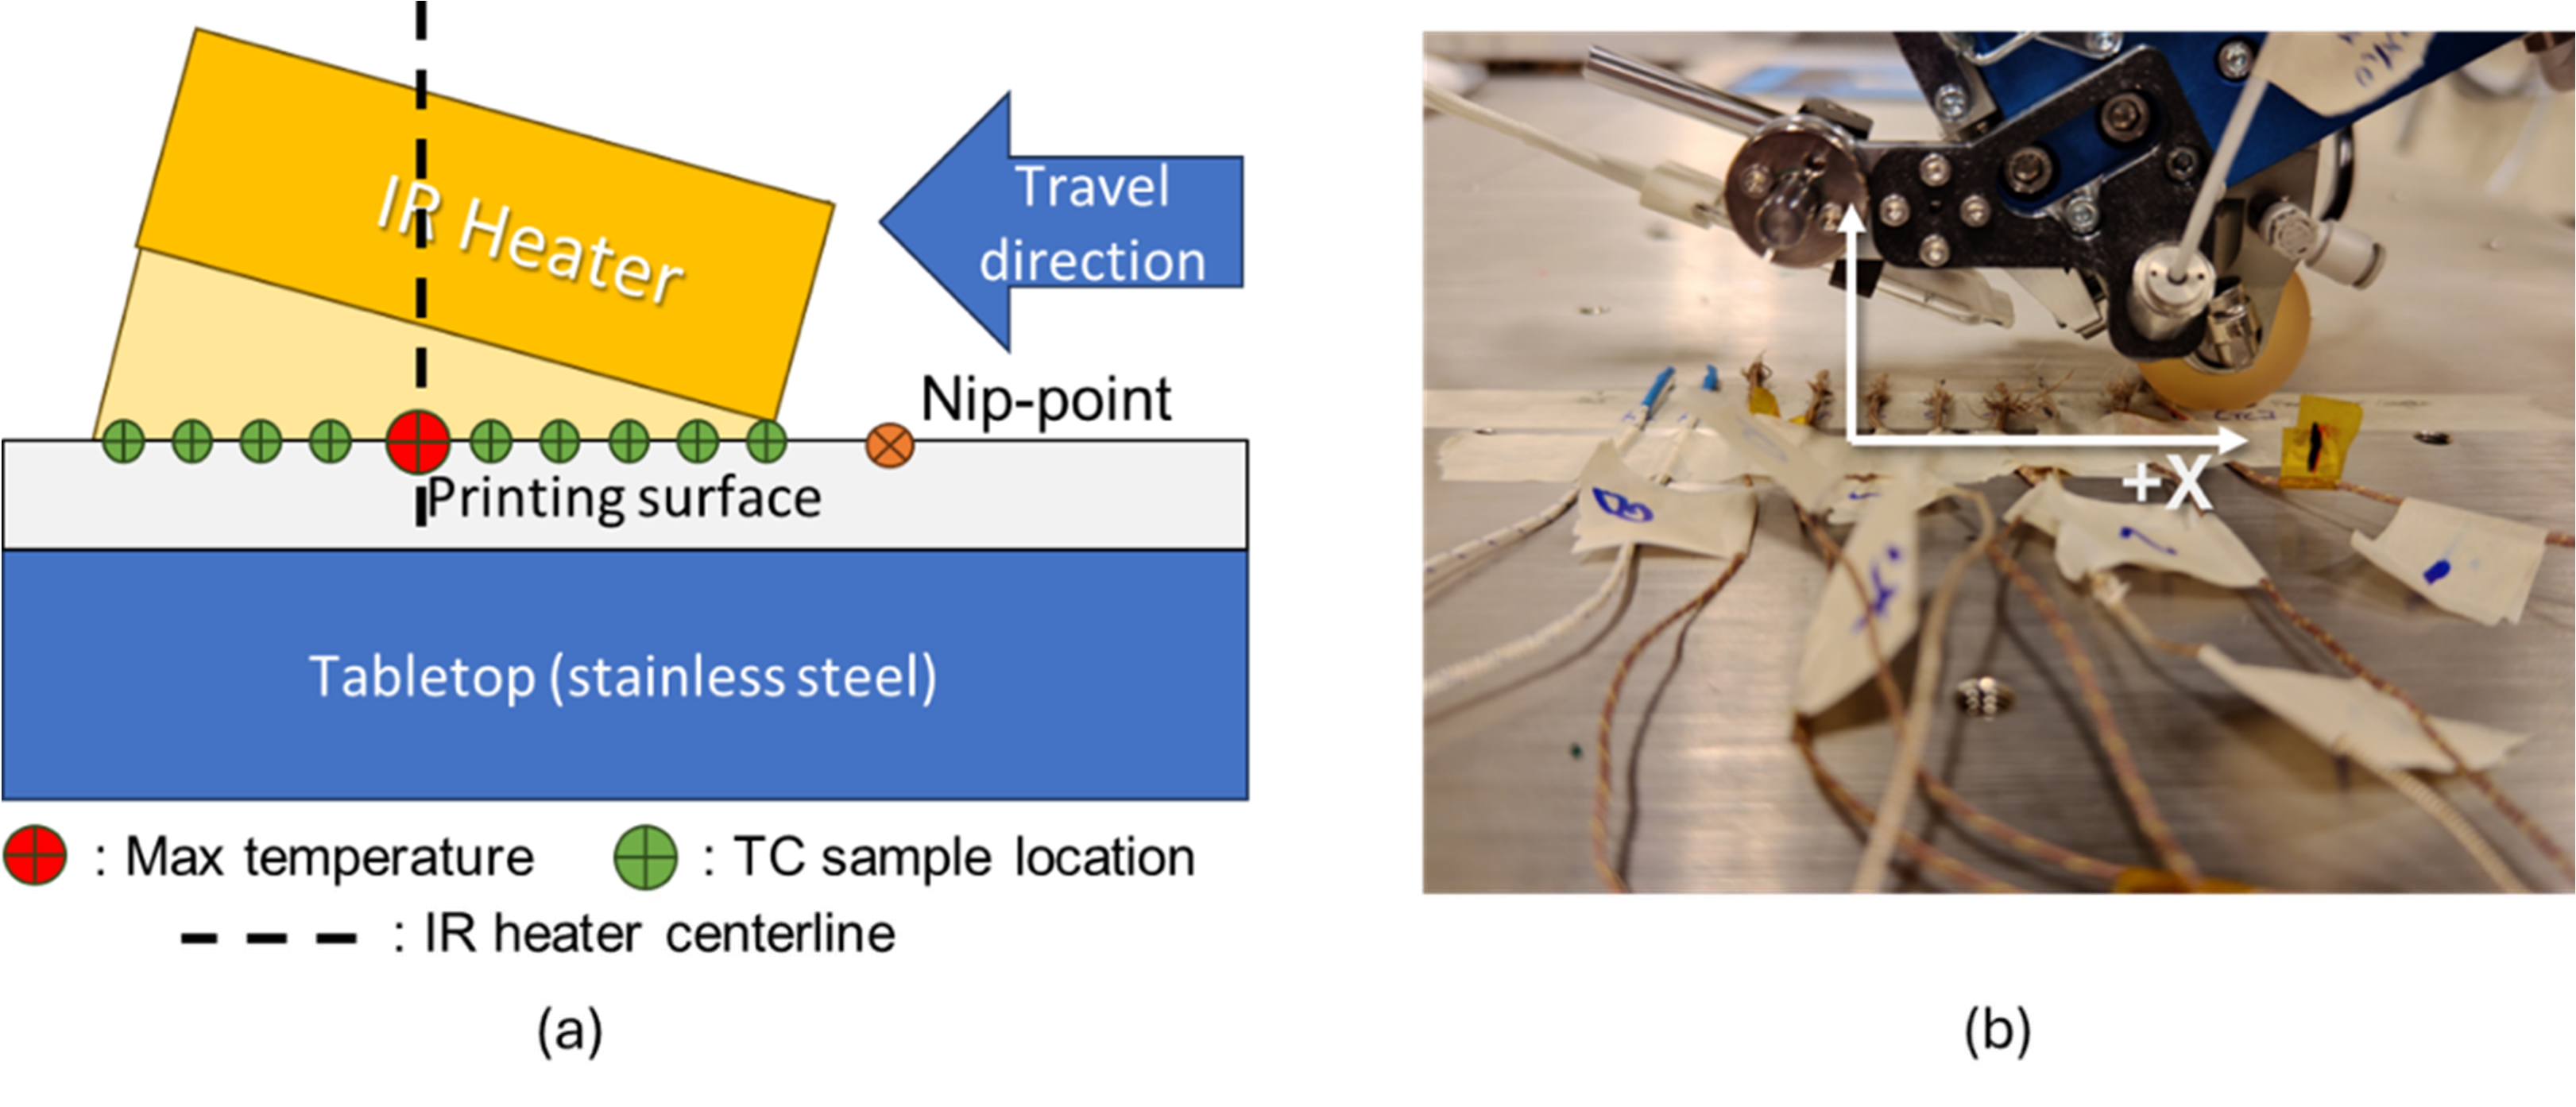
The procedure placed thermocouples in contact with marked surface locations, checked their response, and recorded temperatures after switching the heater to full power. These experiments used a StrainSmart 5000 acquisition system. The custom twelve-channel system below is a later development.
1.2 Measured temperature profiles
The recorded profiles vary across the heated region and evolve with exposure time. Under the tested conditions, the metal table heats more slowly than the polymer-based surfaces. The comparison characterizes the response of each surface at the specified heater setting and exposure times.
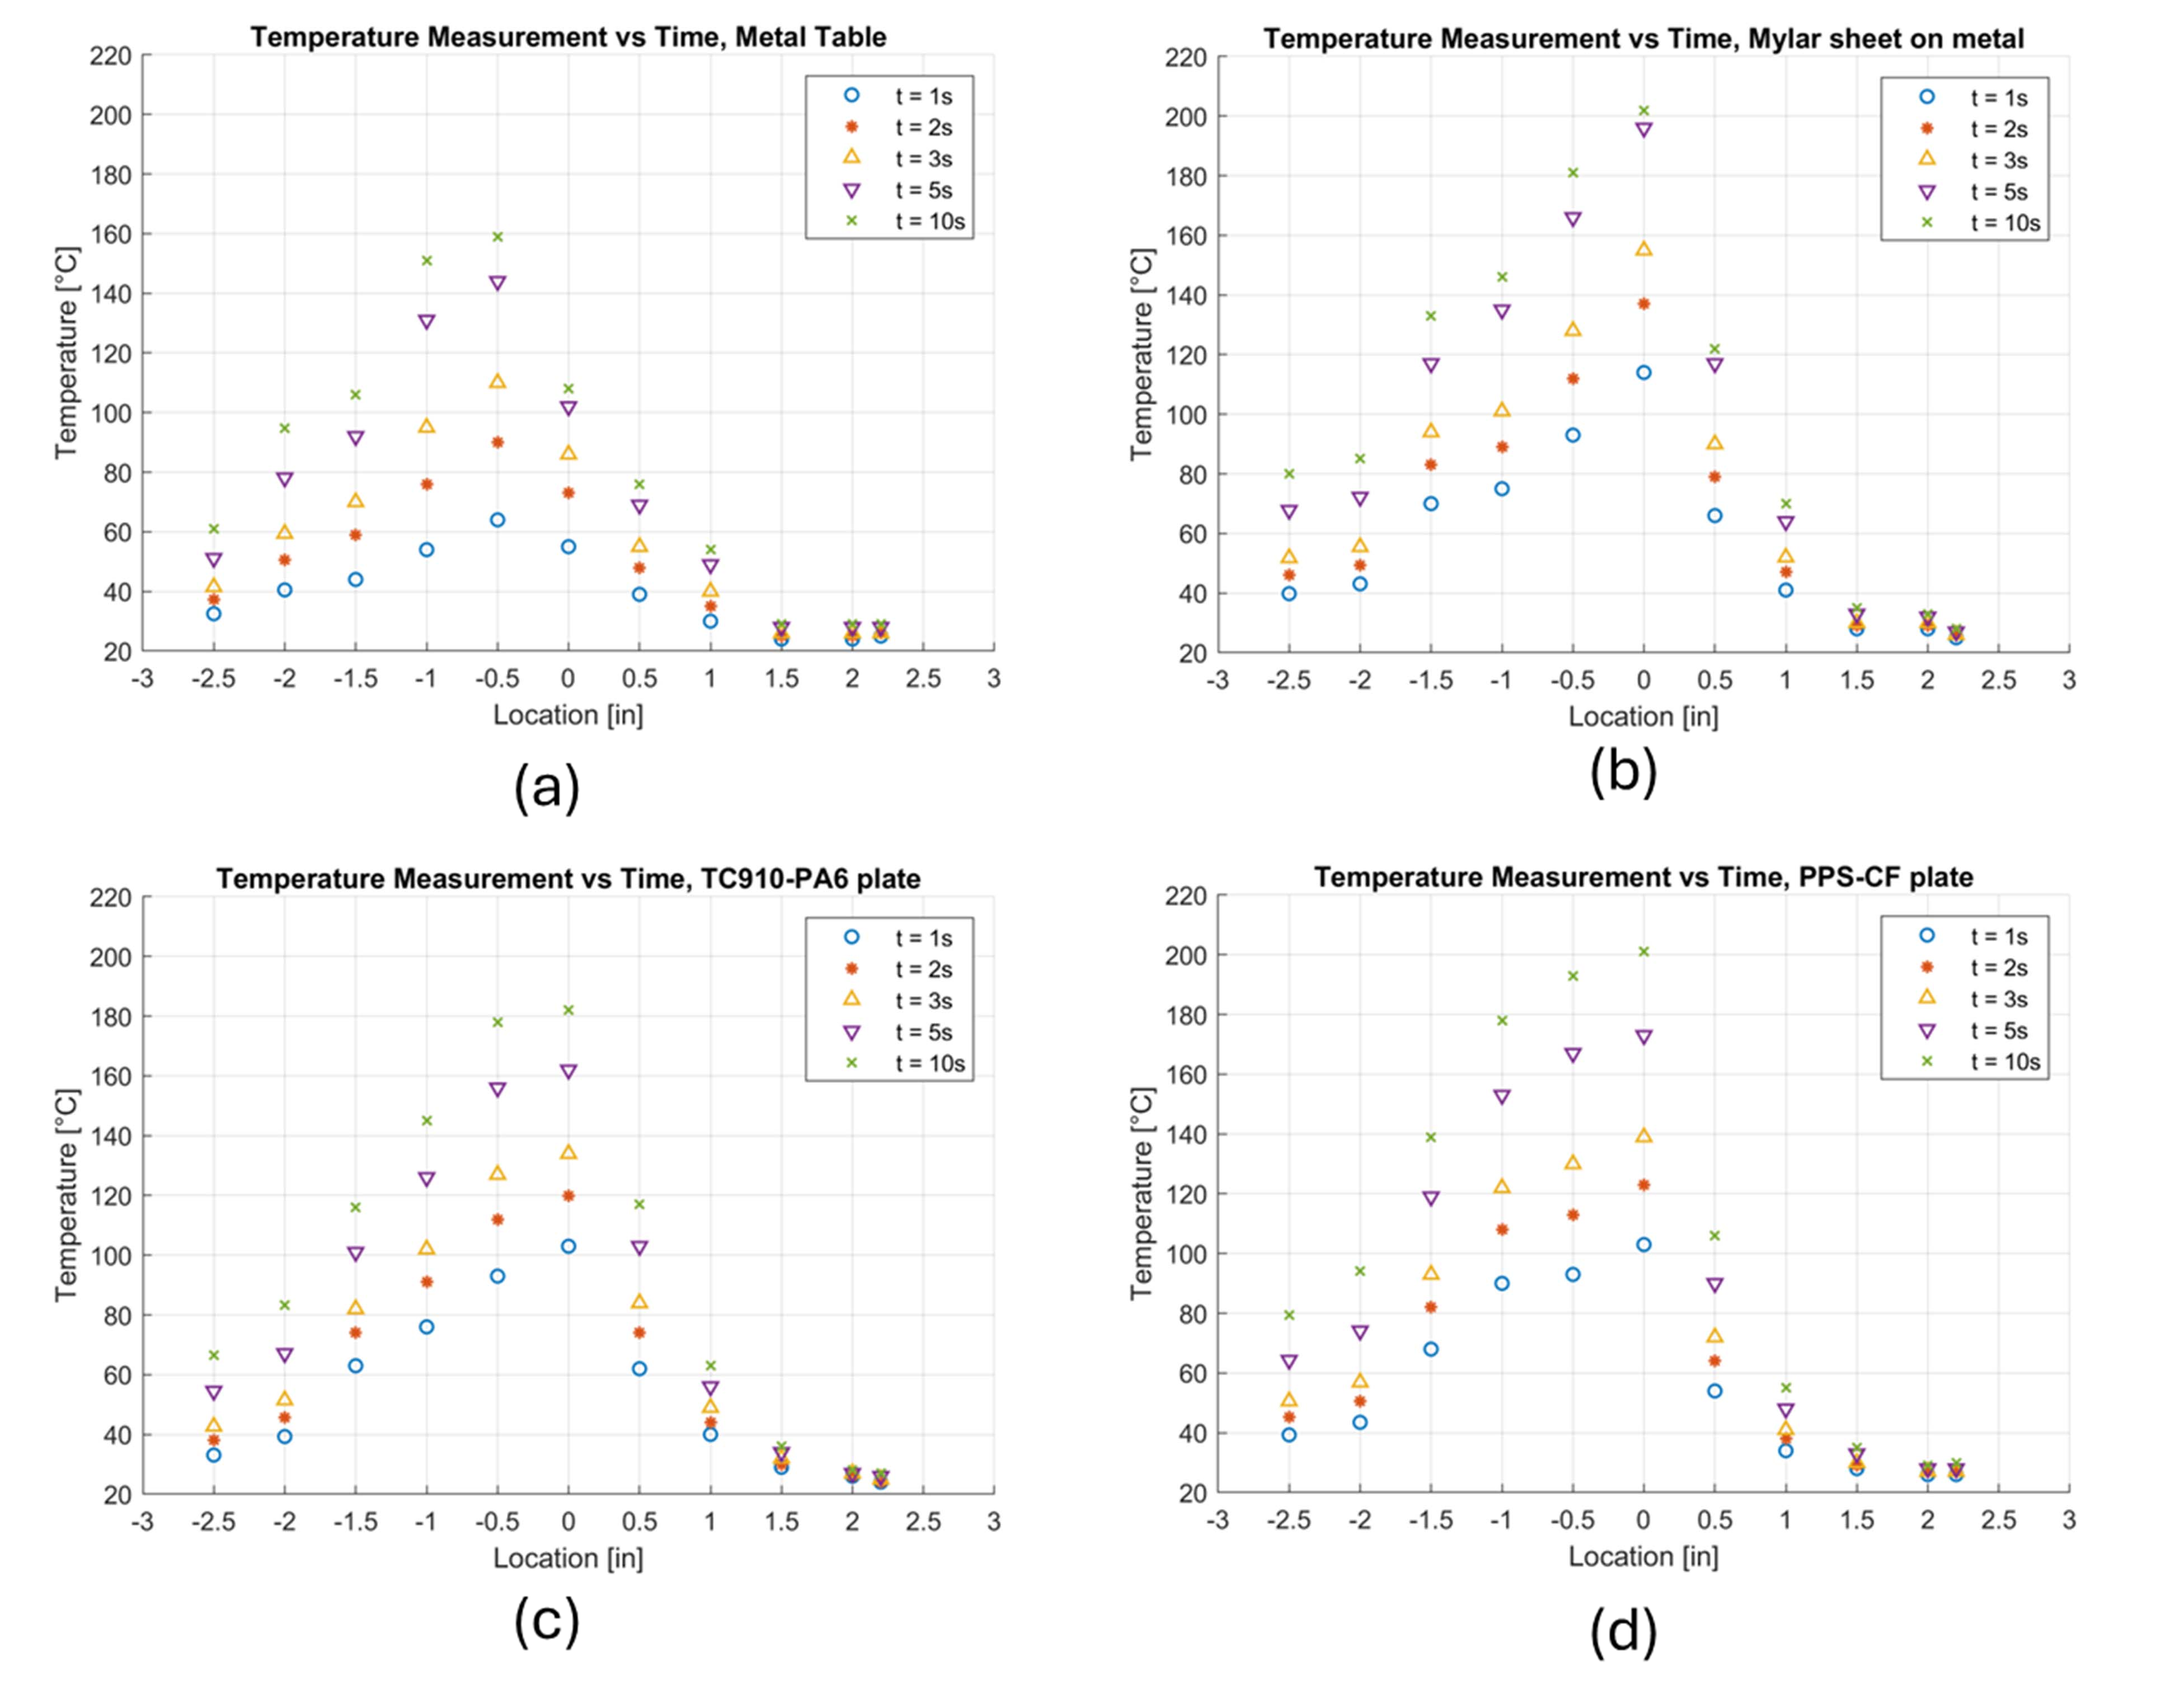
Comparison across measurement locations requires each temperature to remain associated with its sensor position, channel identity, and timestamp. These requirements also inform the later acquisition system.
2. Temperature-acquisition system
2.1 Hardware and signal path
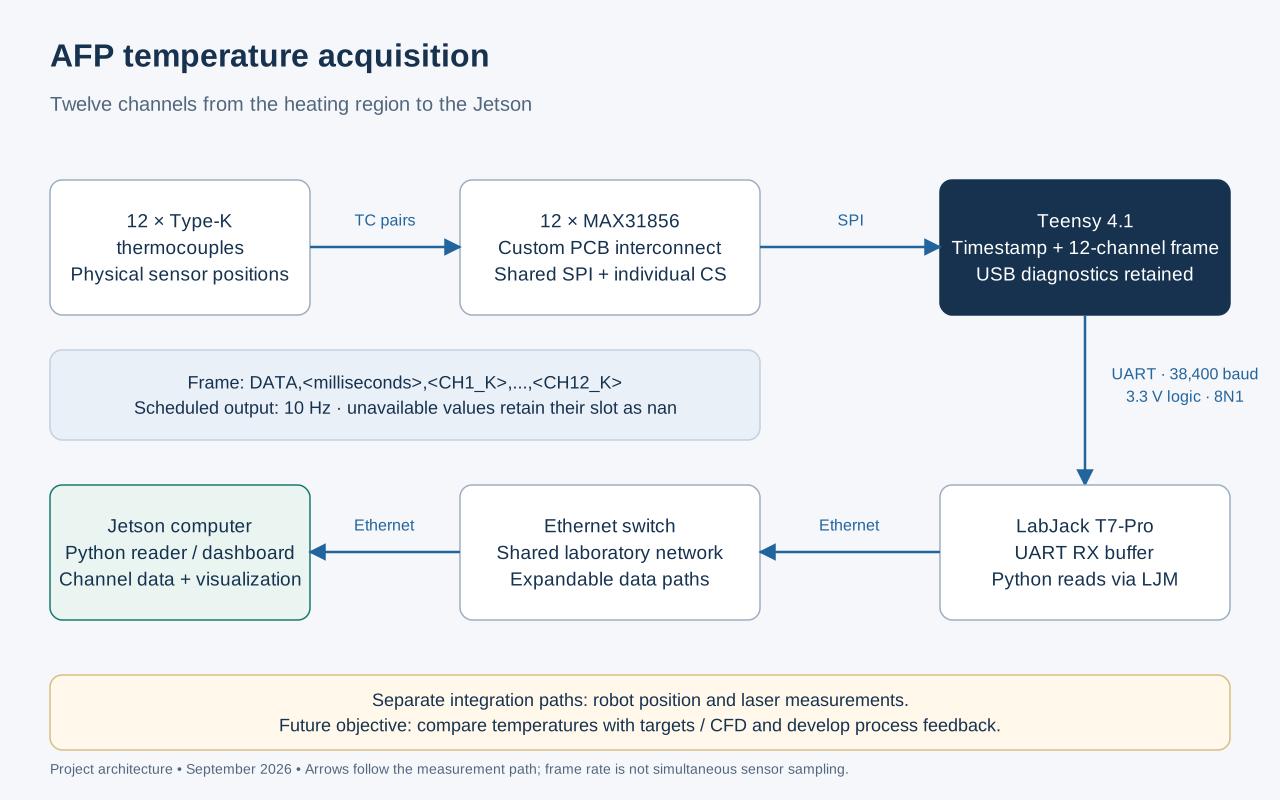
The custom system connects Type-K thermocouples to MAX31856 converter modules on a carrier PCB, then to a Teensy 4.1, a LabJack T7-Pro, and the host software. The board provides twelve channel positions. The supplied hardware photograph shows six populated converter positions, consistent with the six reporting channels in the accompanying dashboard screenshots.
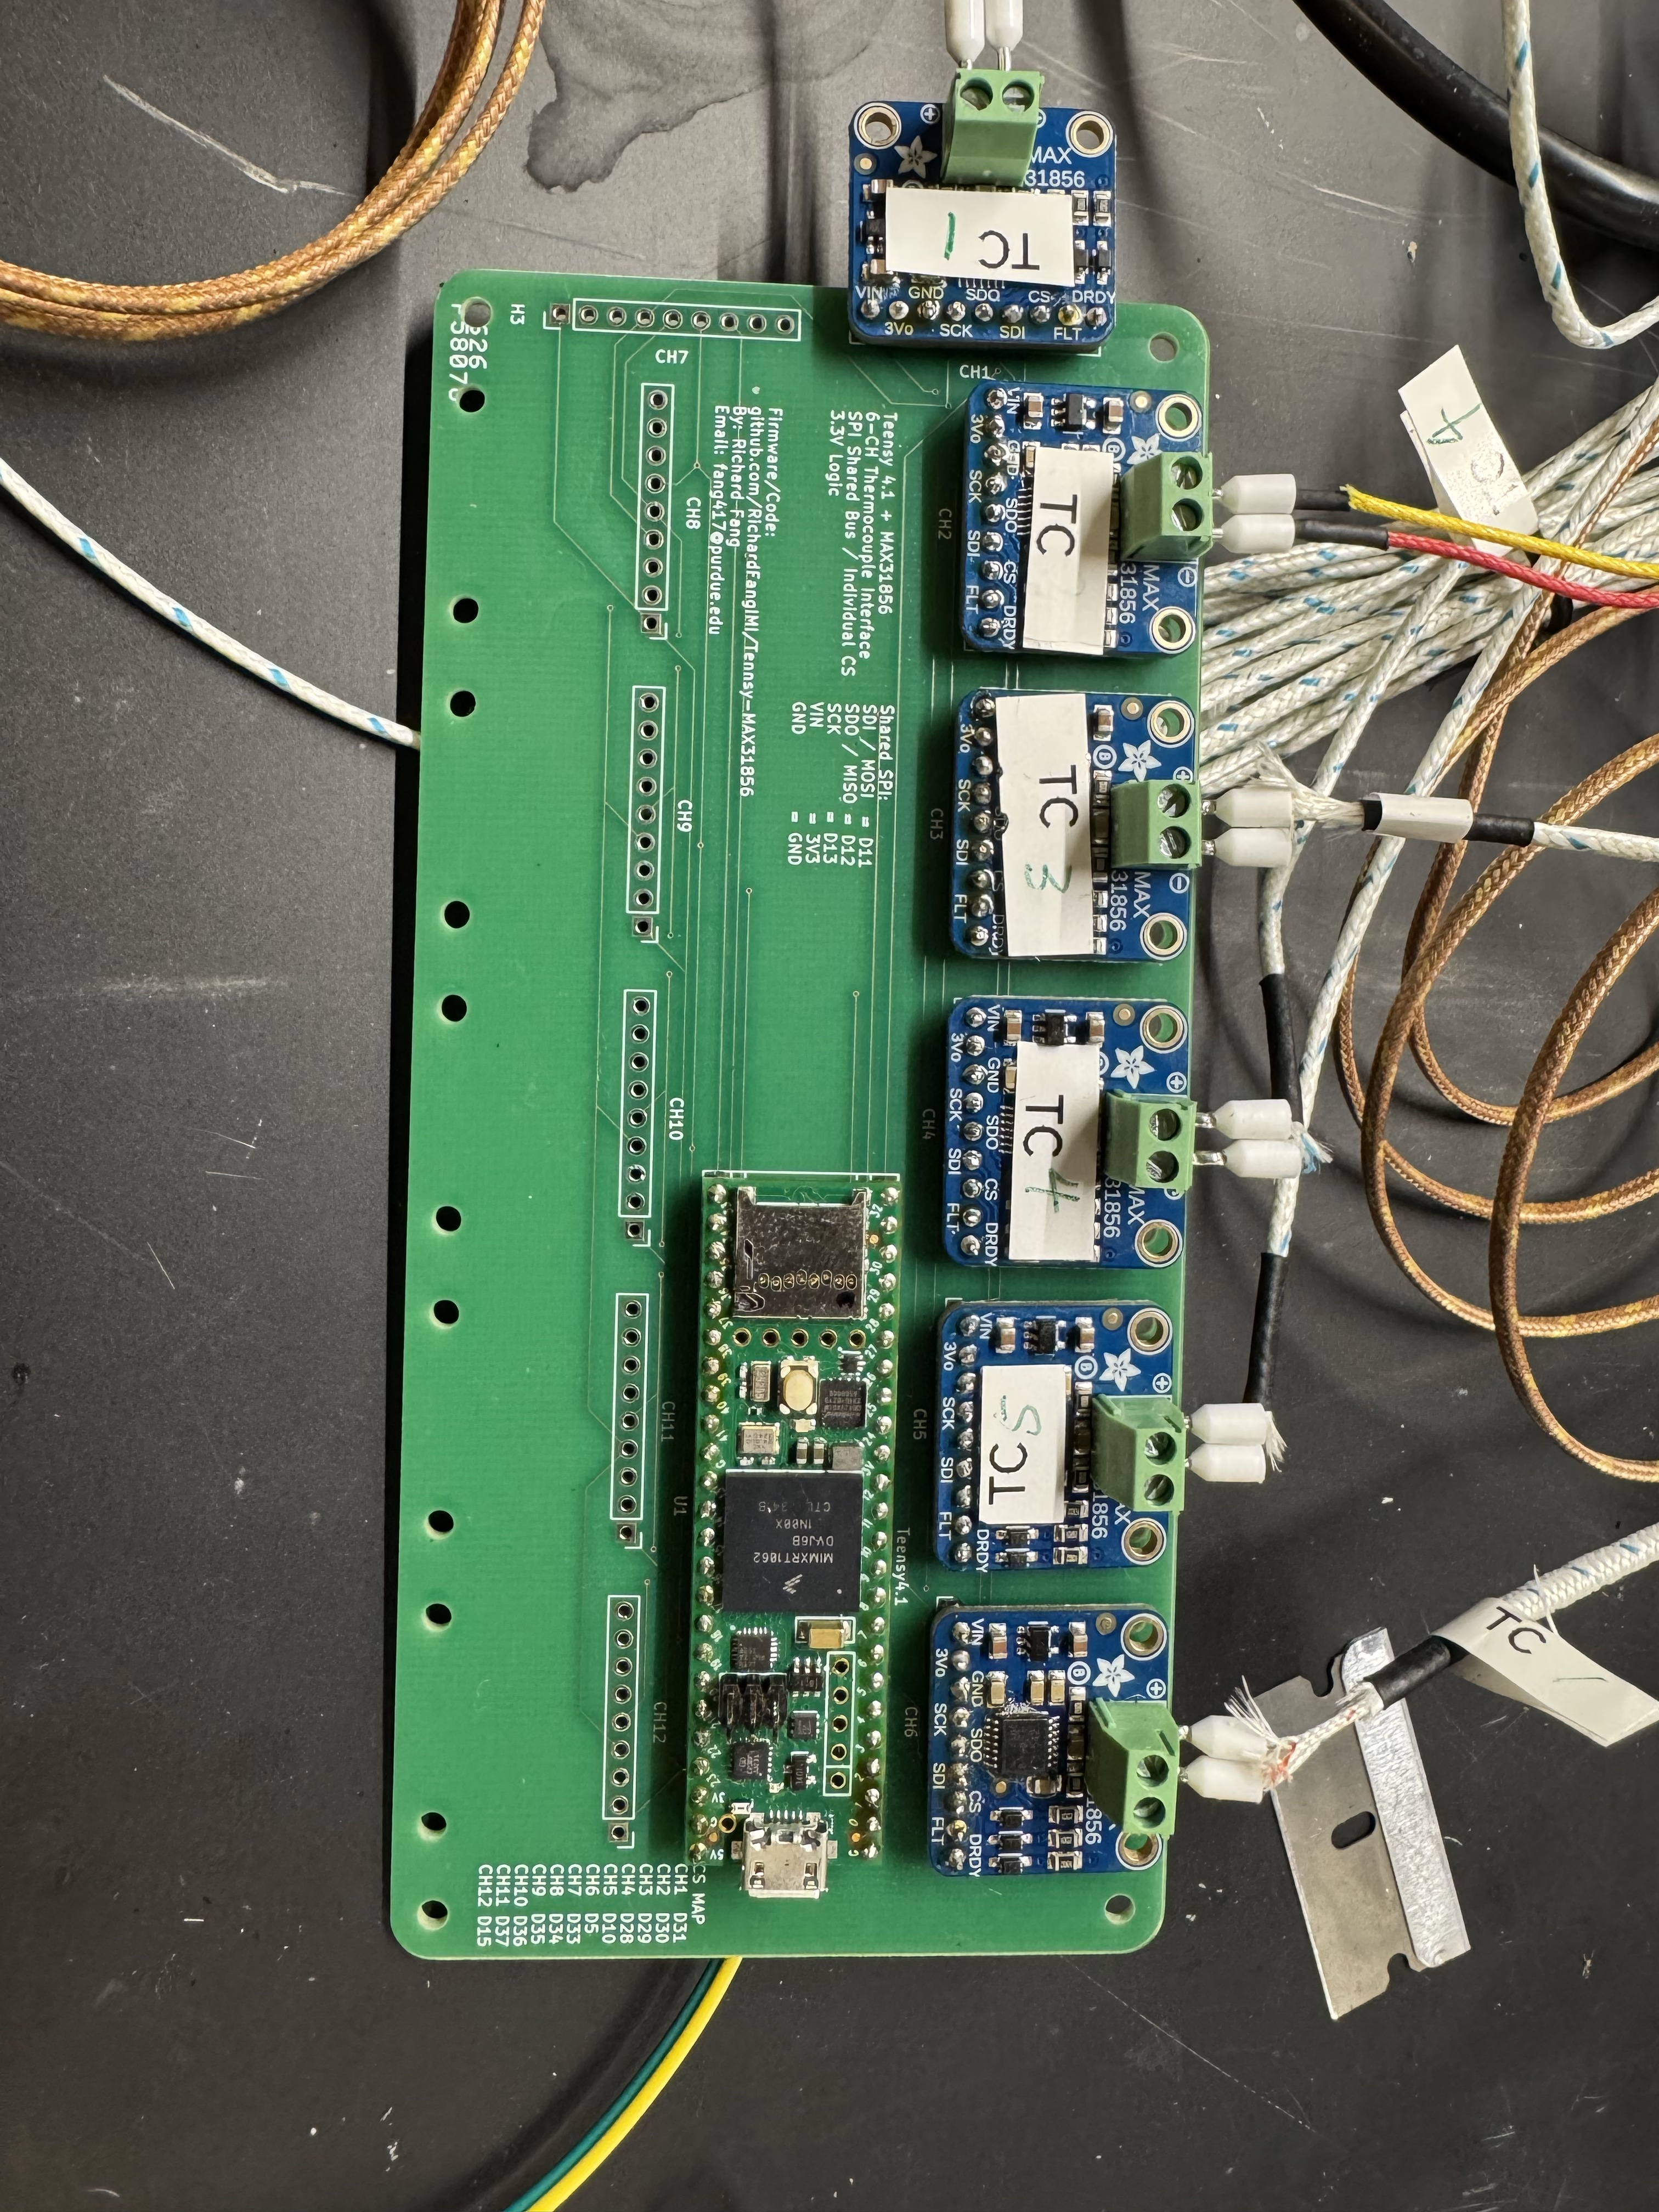
- Sensor interface: a MAX31856 converter for each populated thermocouple channel.
- Shared bus: SPI clock and data lines, with a separate chip select per channel.
- Microcontroller: Teensy reads the channels and constructs a timestamped frame.
- Transport: UART to the LabJack, followed by host-side reading and parsing.
- Presentation: channel values, histories, availability, and data age in the monitoring interface.
The twelve-position layout provides expansion capacity. The photograph and screenshot document the populated configuration at that time.
2.2 Acquisition architecture
2.3 Firmware and communication
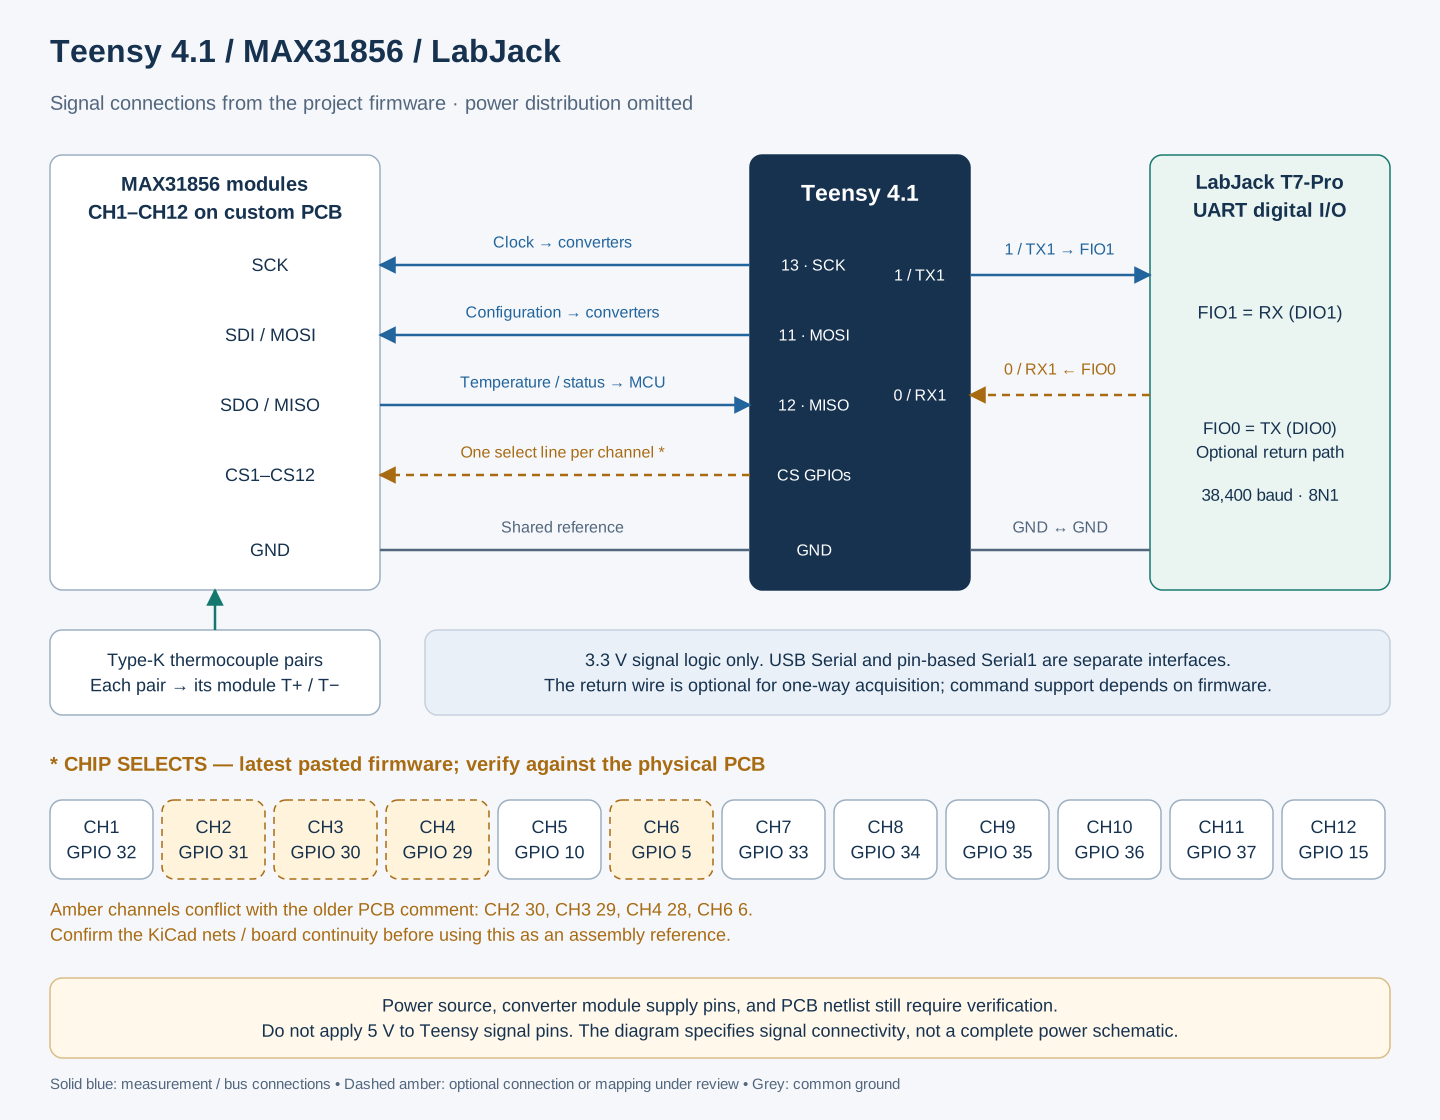
The documented SPI assignments are SCK on pin 13, MOSI on pin 11, and MISO on pin 12. The firmware schedules an output frame every 100 ms, containing the MCU timestamp and twelve fixed channel positions:
DATA,<milliseconds>,<CH1_K>,...,<CH12_K>
Faulted or unavailable channels retain their positions as nan, preserving the mapping between channel number and measurement. USB Serial retains a diagnostic copy; Serial1 sends the stream to the LabJack at 38,400 baud, 8N1. The scheduled 10 Hz frame rate describes output timing; independent conversion rate and channel synchronization require separate measurement.
UART connections and chip-select mapping
| Signal | Teensy 4.1 | LabJack T7-Pro |
|---|---|---|
| Temperature stream | Pin 1, TX1 | FIO1, UART RX |
| Optional return path | Pin 0, RX1 | FIO0, UART TX |
| Reference | GND | GND |
The LabJack assignments are ASYNCH_RX_DIONUM = 1 and ASYNCH_TX_DIONUM = 0. The optional return connection requires matching command-handling firmware before it can be used for control.
The saved twelve-channel PCB designs and the later firmware agree on this CH1–CH12 chip-select sequence:
32, 31, 30, 29, 10, 5, 33, 34, 35, 36, 37, 15
Earlier code comments and the photographed board’s printed mapping differ from the saved design. The signal drawing remains a reference: the assembled board, installed firmware, and physical sensor positions should be checked together before using it as a wiring instruction.
3. Monitoring software
3.1 Multisensor overview
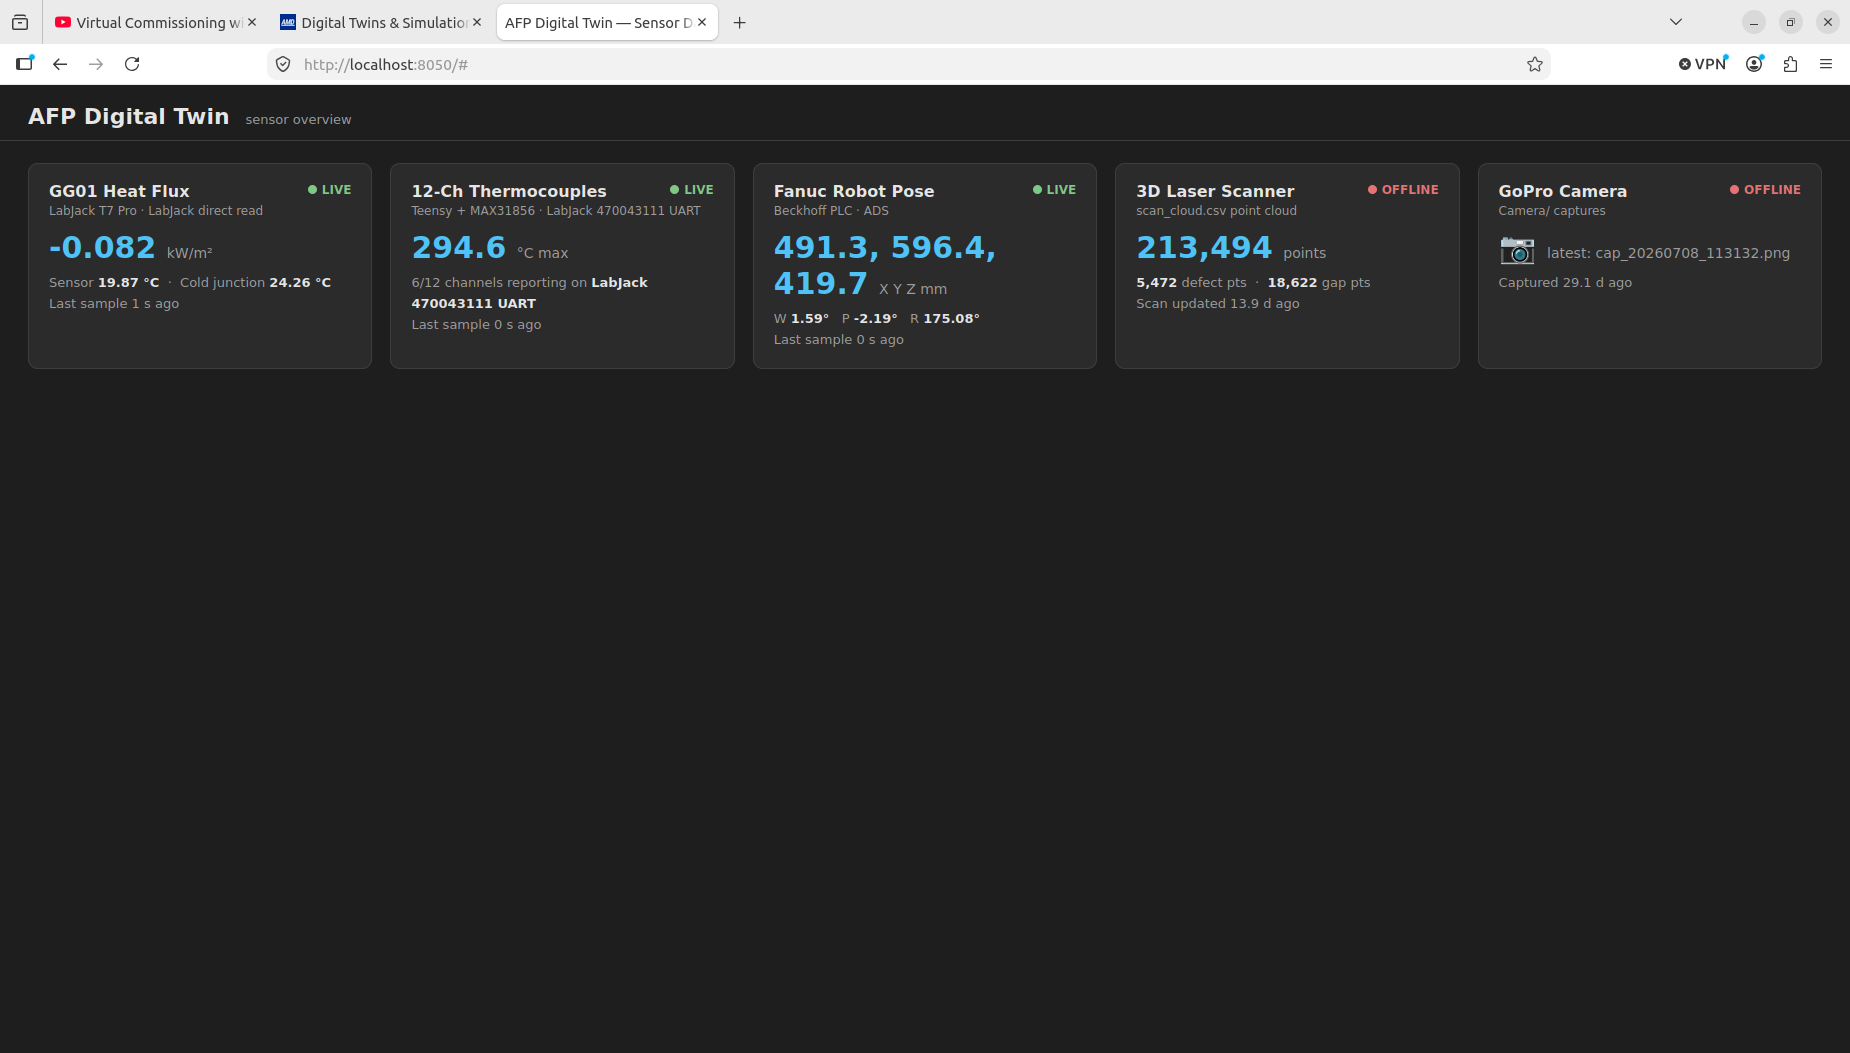
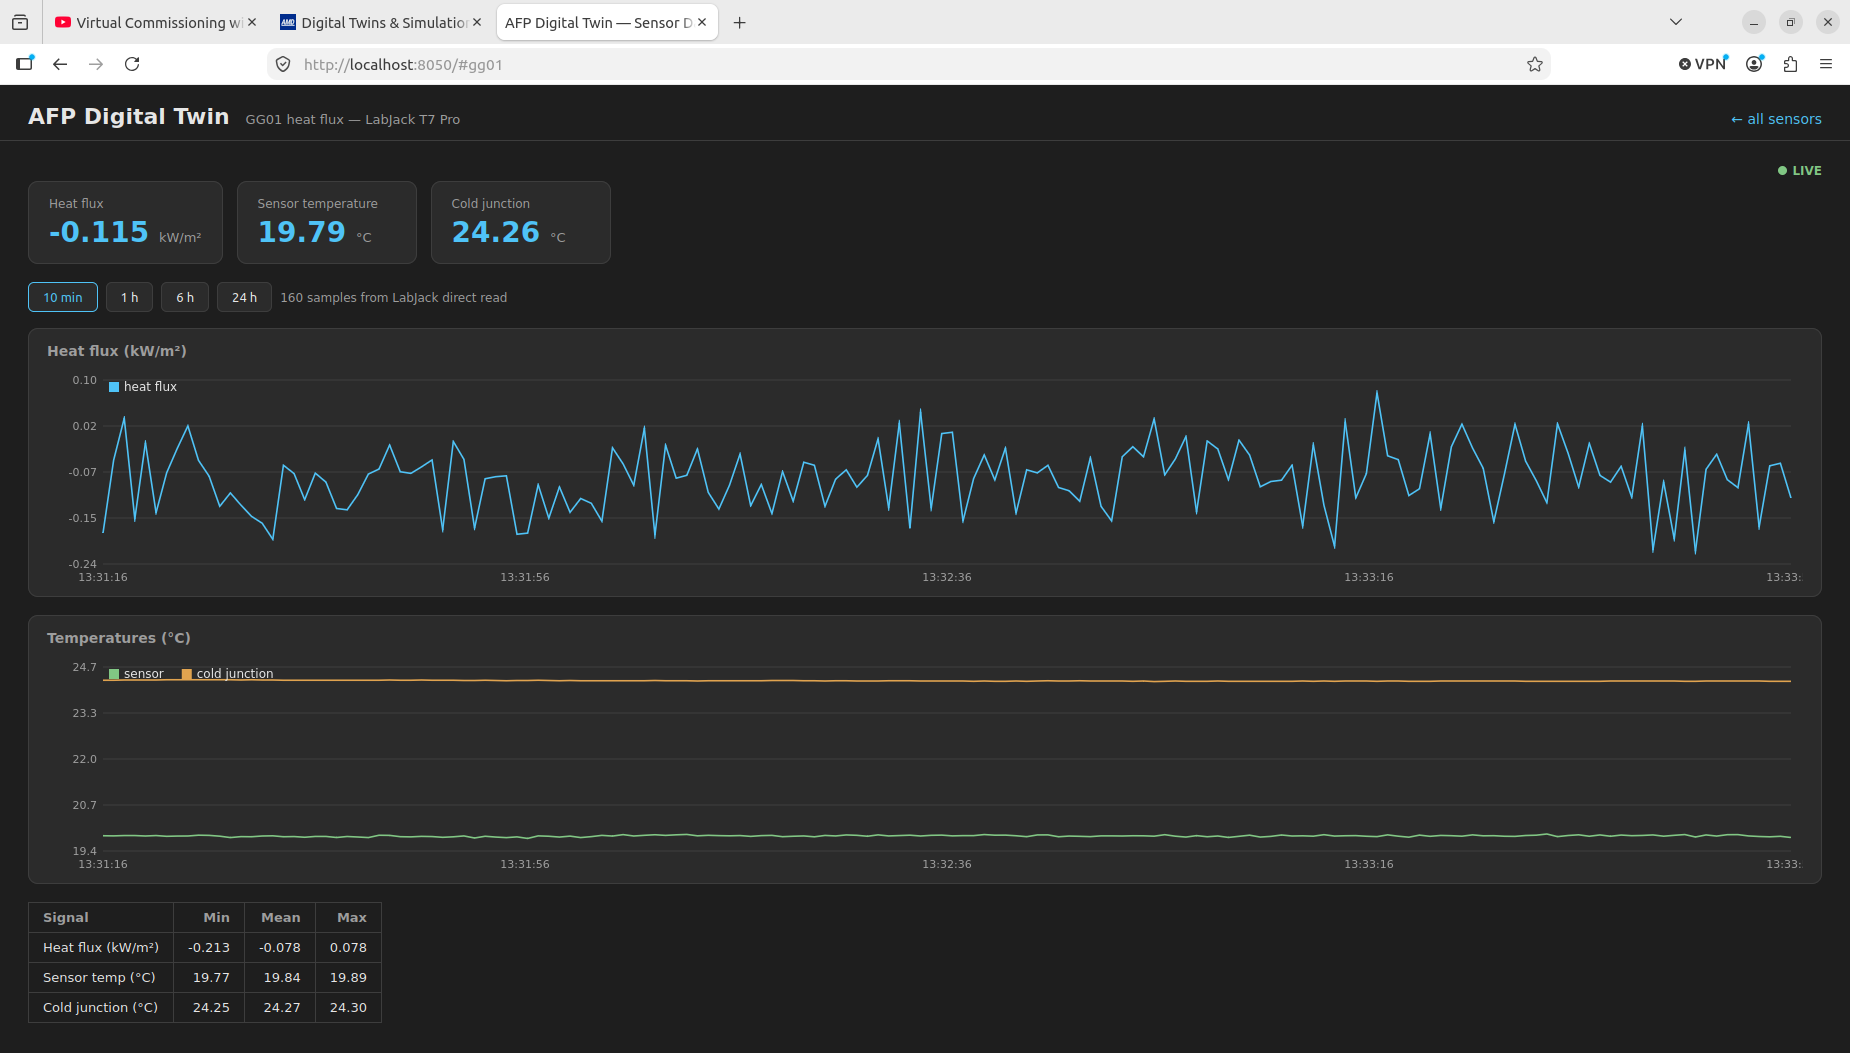
The browser interface combines a sensor overview with dedicated views for heat flux, thermocouples, robot pose, and a recorded laser scan. Each source displays its availability and data age. The August 2026 development screenshots document the configuration and source status at the time of capture.
| Data source | Interface shown | State in the supplied capture |
|---|---|---|
| GG01 heat flux | Direct LabJack T7-Pro reading | Live status; heat-flux and temperature histories |
| Thermocouples | Teensy + MAX31856 through LabJack UART | Six of twelve channels reporting |
| FANUC robot pose | Beckhoff PLC / ADS | Live status; XYZ position and WPR orientation histories |
| 3D laser scanner | Recorded scan_cloud.csv point cloud | Offline; last recorded scan displayed |
| GoPro camera | Last captured image reference | Offline; an earlier capture is listed |
Inspect the heat-flux, robot-pose, and recorded-scan views
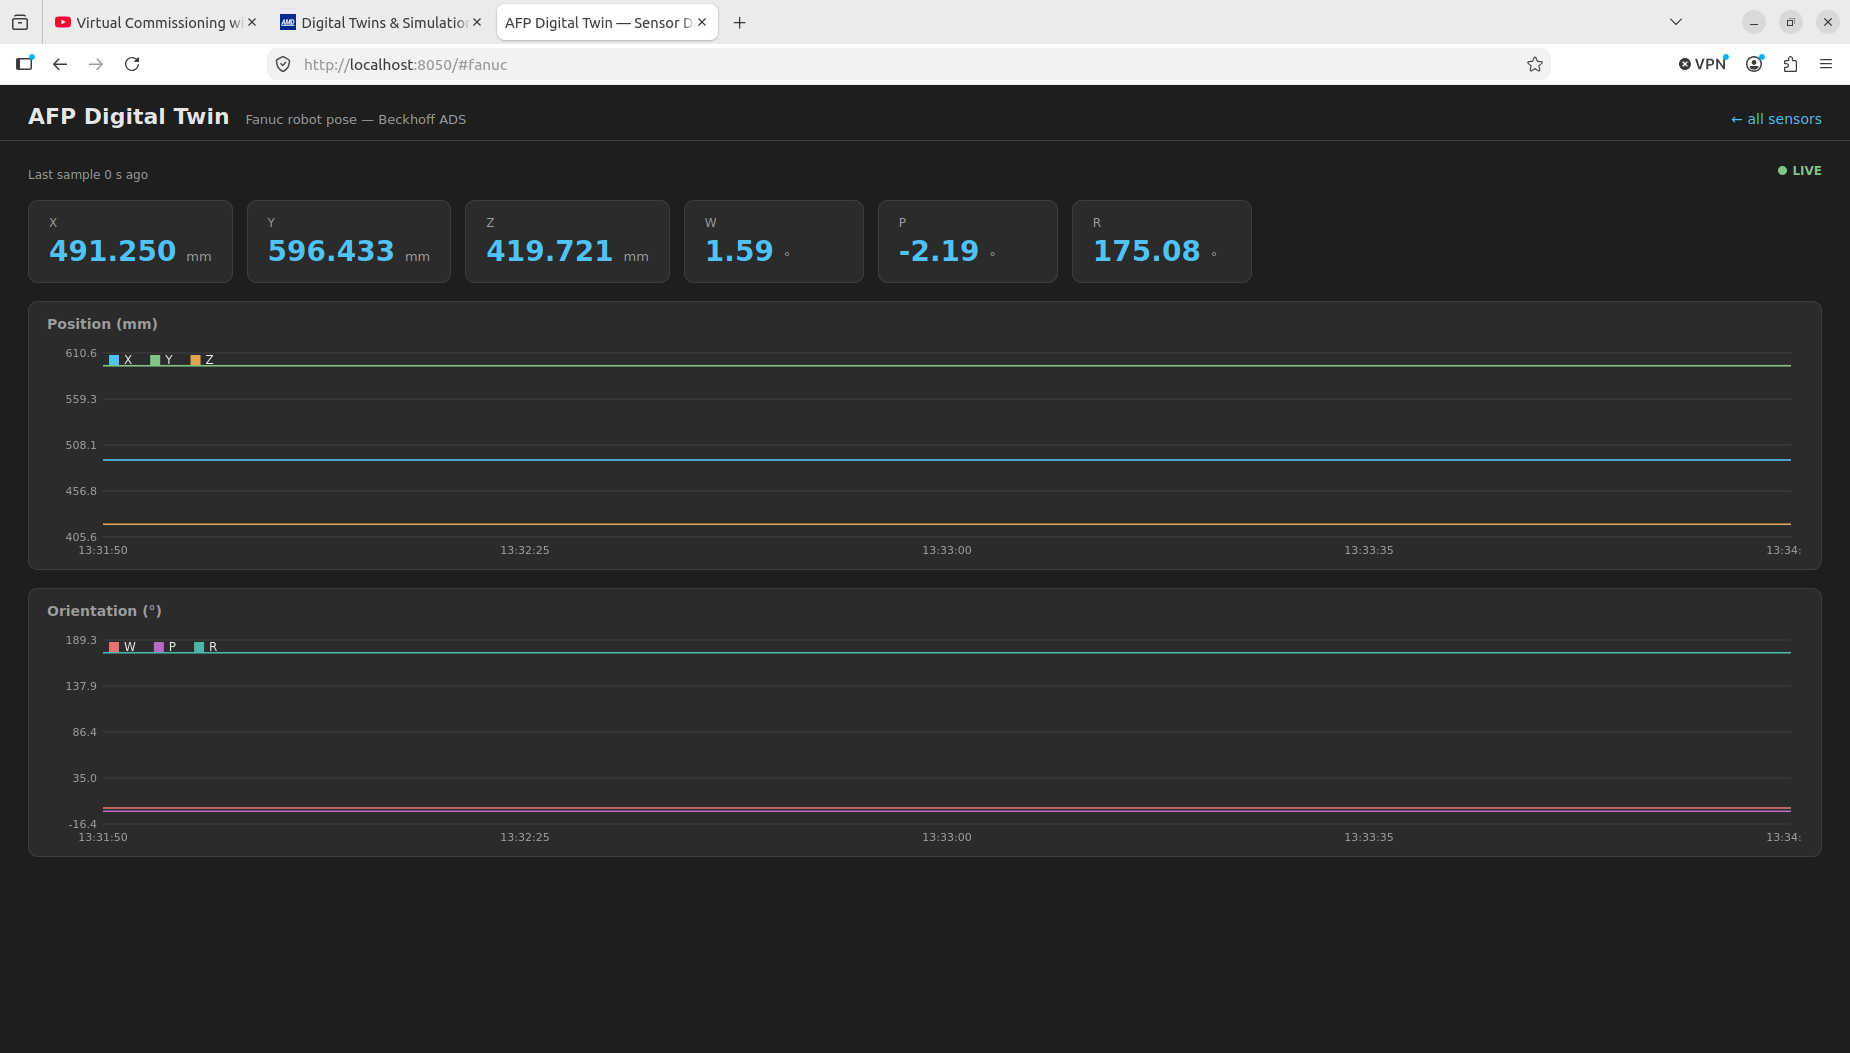
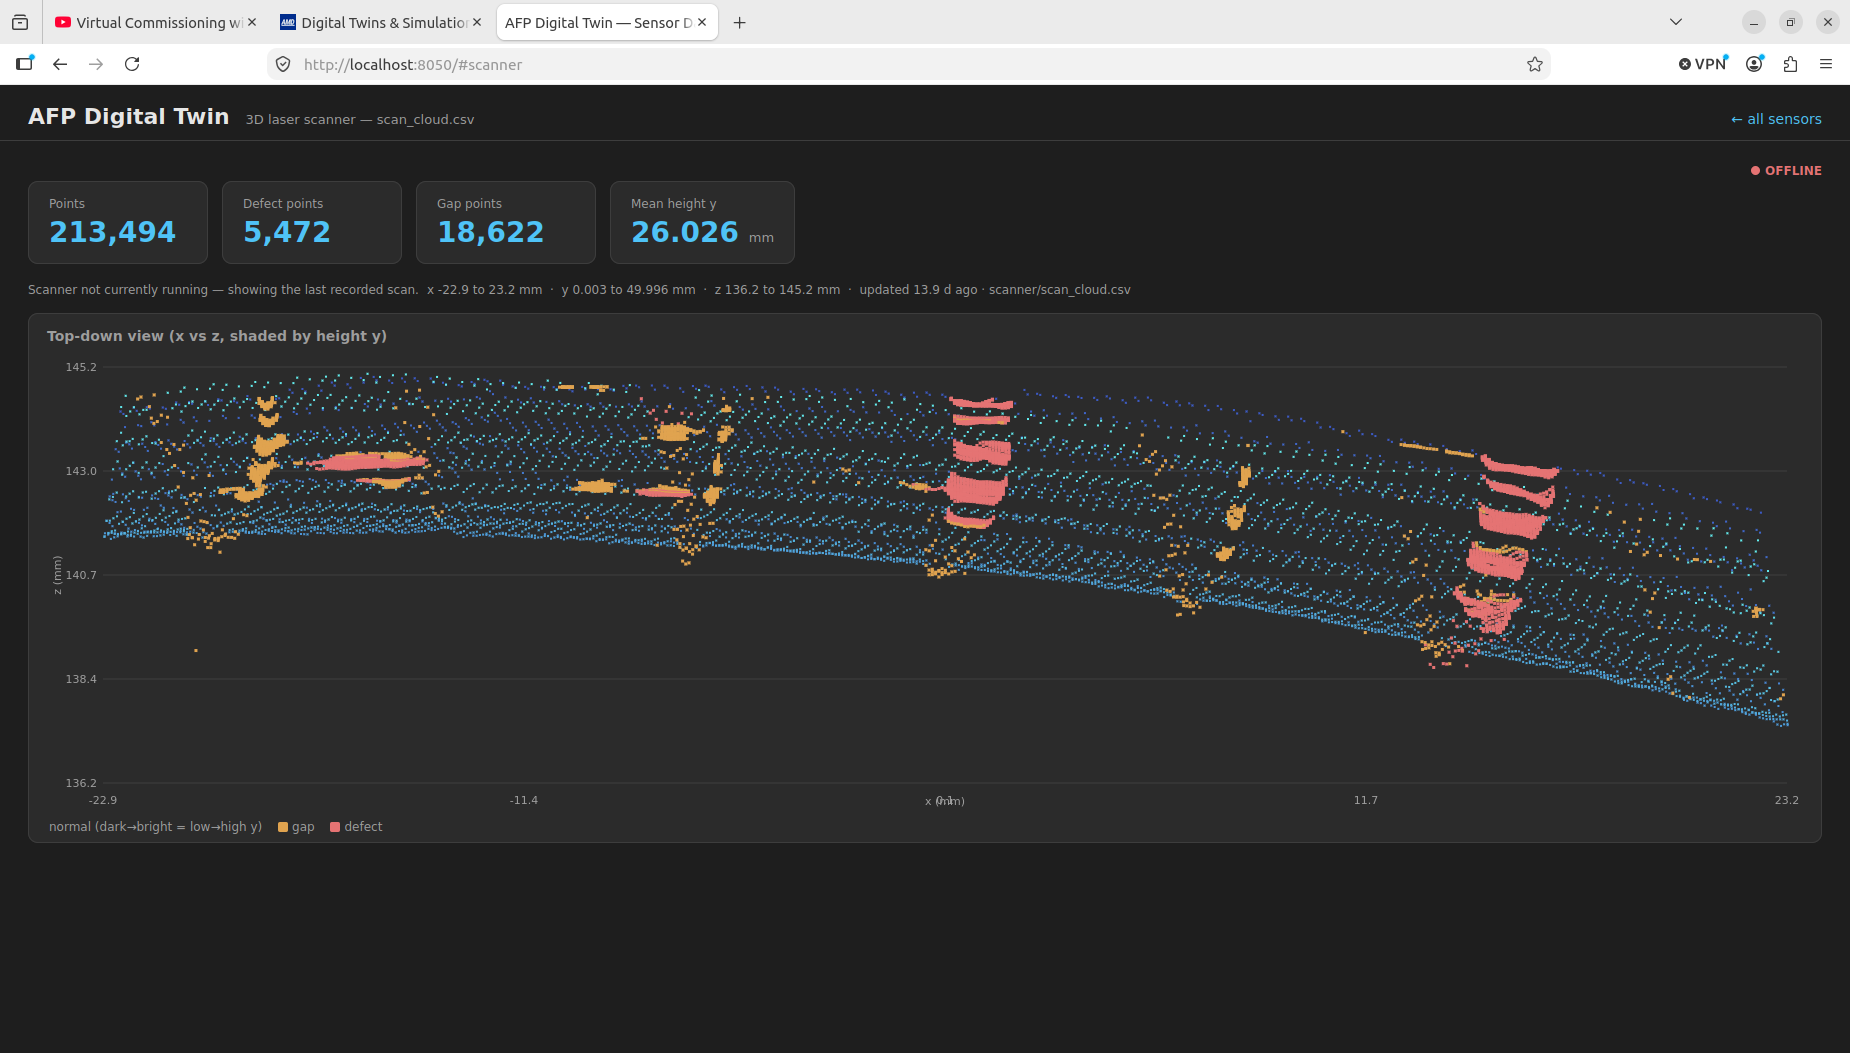
3.2 Temperature channels and units
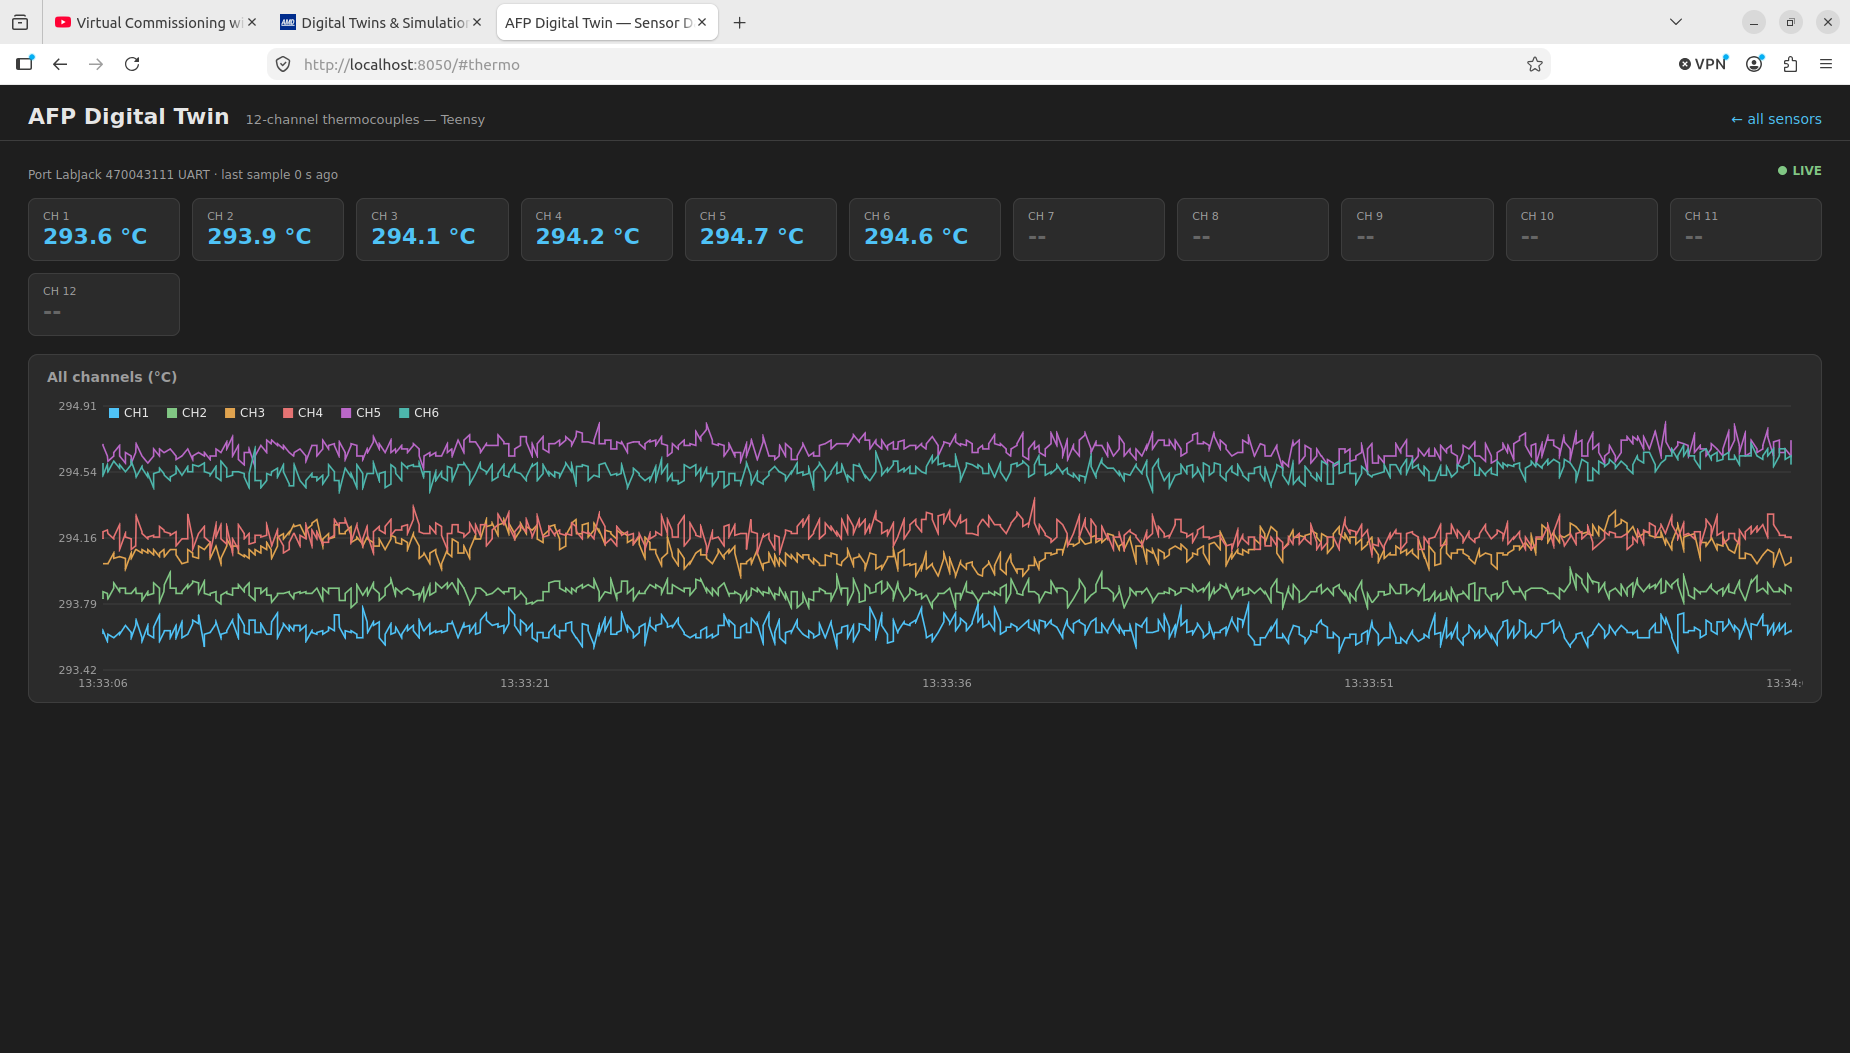
Preserving unavailable channels in the interface makes the populated configuration visible. Keeping units consistent from the transmitted frame through the parser and chart labels is also essential for interpreting the measurements.
3.3 Data handling and software development
The earlier temperature dashboard used Tkinter and pySerial over USB. The later LabJack path reads the UART receive buffer through LJM, assembles complete lines, and parses the channel frames. The browser interface integrates this thermocouple stream with the other sensor views.
Source availability, data age, and a stable channel schema support interpretation of the combined display. The documented implementation provides acquisition and visualization; closed-loop heater control and validated defect detection remain development objectives.
4. Measurement quality and next steps
- Traceability: associate channel numbers with sensor locations and retain acquisition timestamps.
- Unit consistency: carry kelvin from the firmware into the parser and apply an explicit conversion when displaying Celsius.
- Timing: measure effective update rate, dropped frames, and timing offsets before treating multiple streams as synchronized.
- Hardware configuration: match the physical board revision, chip-select assignments, and populated channels to the running firmware.
- Experimental comparison: retain sensor mounting, calibration, and raw recordings when comparing temperature histories across surfaces or against the team’s predictions.
Hardware references and image credits
For the signal-interface references, see PJRC’s Teensy 4.1 documentation, PJRC’s hardware UART reference, and LabJack’s asynchronous serial documentation. The existing signal design uses 3.3 V logic.
The three experimental figures above are team materials. Their source copyright notice is retained: “Copyright 2025. Used by the Society of the Advancement of Material and Process Engineering with permission.” The later hardware photograph and dashboard screenshots were supplied separately. See credits and licenses.