Infusion / TPS
Three-scale resin-infusion CFD and cure-dependent material modeling for woven thermal protection systems.
COMPOSITE PROCESSING · MULTISCALE CFD · MATERIAL MODELING
This project investigates resin infiltration and cure-dependent material behavior in woven thermal protection systems (TPS). Flow through gaps between fibers, channels between tows, and the overall porous panel occurs at different length scales; resolving these mechanisms is needed to assess non-uniform filling and local gas retention. The modeling framework combines simulations at these three scales with a separate material-model development for curing.
I carried out the Purdue-side work presented in the January 5, 2026 Phase I review: micro-, meso-, and macro-scale infusion simulations and development of a cure-dependent material subroutine. My work included the flow representations, model setup, and analysis of the results shown below. Within the Purdue–AnalySwift collaboration, AnalySwift led the permeability-homogenization and optimization method and the software interface/plugin work.
Modeling framework Infusion simulations Material development Results and validation
1. Modeling framework
A woven TPS preform contains narrow flow paths within fiber tows and larger channels between them. Three model representations address these features at progressively larger scales, from individual fiber surfaces to the overall panel.
| Scale | Model representation | Analysis objective |
|---|---|---|
| Micro | Explicit 3 × 3 fiber array with a two-phase interface | Capillary wetting and local gas entrapment |
| Meso | TexGen woven geometry, porous tow interiors, and resolved inter-tow channels | Preferential flow and non-uniform tow infiltration |
| Macro | Homogenized panel with directional Darcy permeability | Overall front propagation in the porous panel |
The infusion simulations use CONVERGE CFD. Each representation consists of geometry and flow-domain definition, specification of fluid or porous-medium properties, and analysis of the evolving liquid front. The longer-term objective is to transfer calibrated effective properties between scales. At the January 2026 review, the three simulations remained separate demonstrations with preliminary inputs, including prescribed macro-scale permeability.
2. Infusion simulations
2.1 Micro scale: fiber-level wetting
Model setup
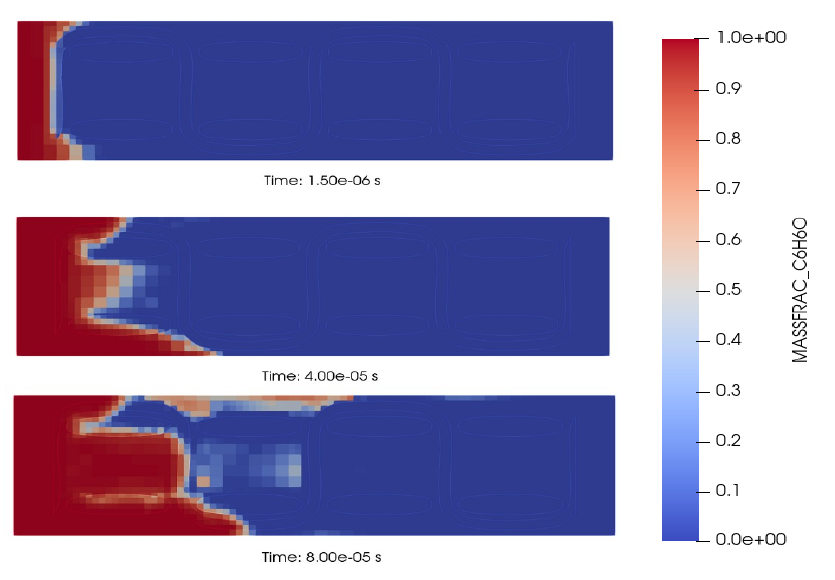
The micro model resolves nine fibers, each 7 µm in diameter, at a fiber volume fraction of 0.6. A pressure gradient drives liquid into an initially gas-filled domain. A volume-of-fluid (VOF) representation tracks the front, with surface tension and wall adhesion capturing wetting at the fiber surfaces. The model treats the liquid as incompressible and the gas as compressible.
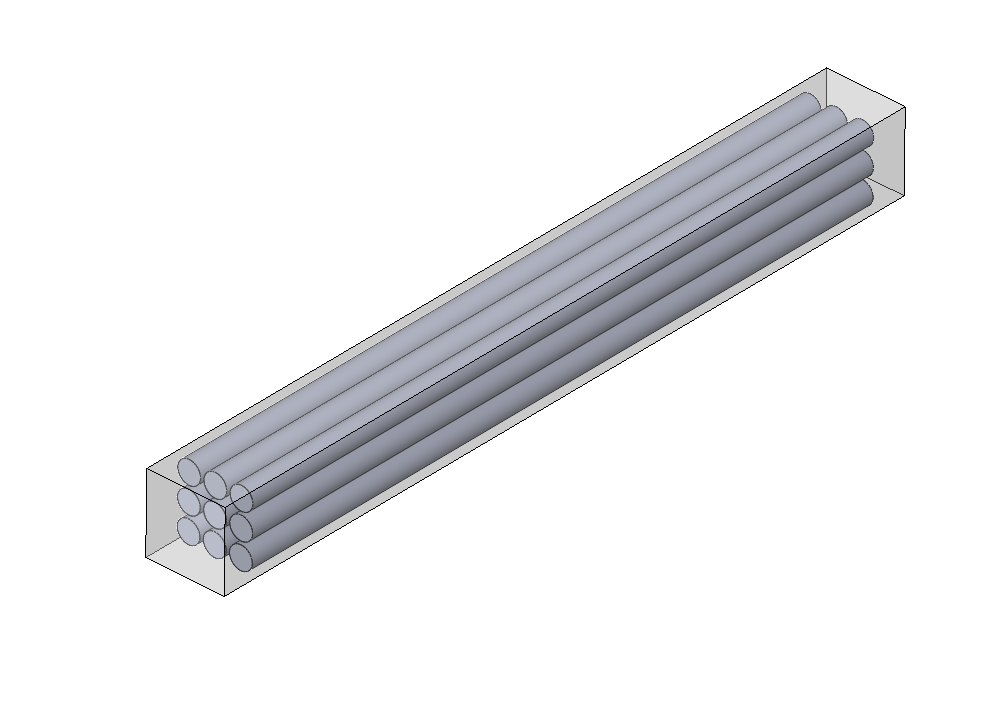
Simulation results
The liquid front changes shape and slows as it advances between fibers. Under the preliminary wetting inputs, the simulation shows local front retardation and gas entrapment in the resolved gaps. These results describe fiber-scale mechanisms that are absent from a uniform porous representation.
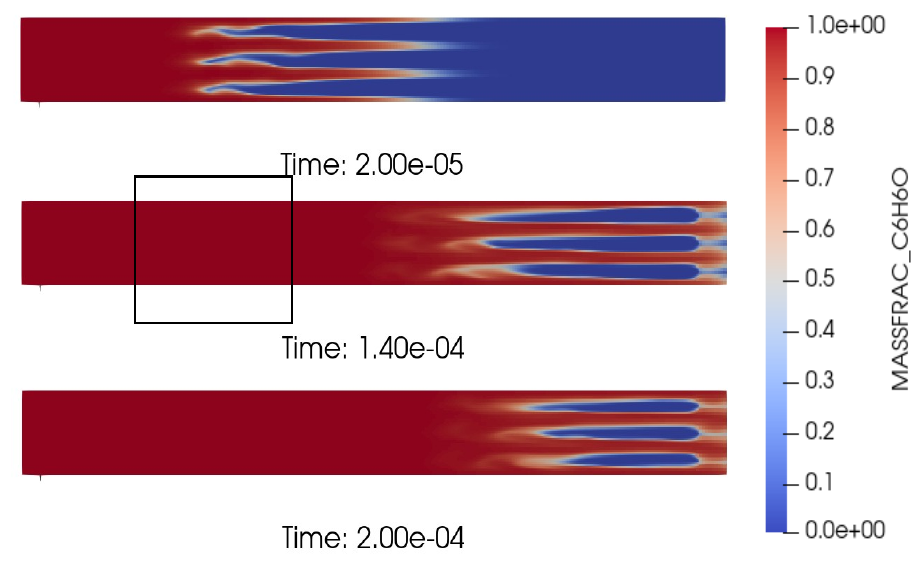
Preliminary fluid inputs and a second simulation view
The review uses phenol (C₆H₆O) as the demonstration fluid at 350 K, with surface tension 35 mN/m, viscosity 2 mPa·s, and an assumed contact angle of 30°. These inputs require material-specific measurement before the model can predict the behavior of a particular TPS resin system. The liquid mass-fraction plots do not measure degree of cure or experimental void content.
2.2 Meso scale: flow through the weave
Model setup
The meso-scale model uses a 3D woven geometry generated in TexGen and imported into CONVERGE. Resolved free flow in the channels between tows is combined with Darcy resistance inside the tows. Fluid exchange across tow boundaries connects the two descriptions.
The setup includes warp and binder tows, a 0.02 mm spacing, and a 4.6 mm flow-domain length that includes inlet and outlet extensions. Directional resistance inside each tow represents the difference between longitudinal and transverse flow. Those resistance values are preliminary inputs awaiting calibration.
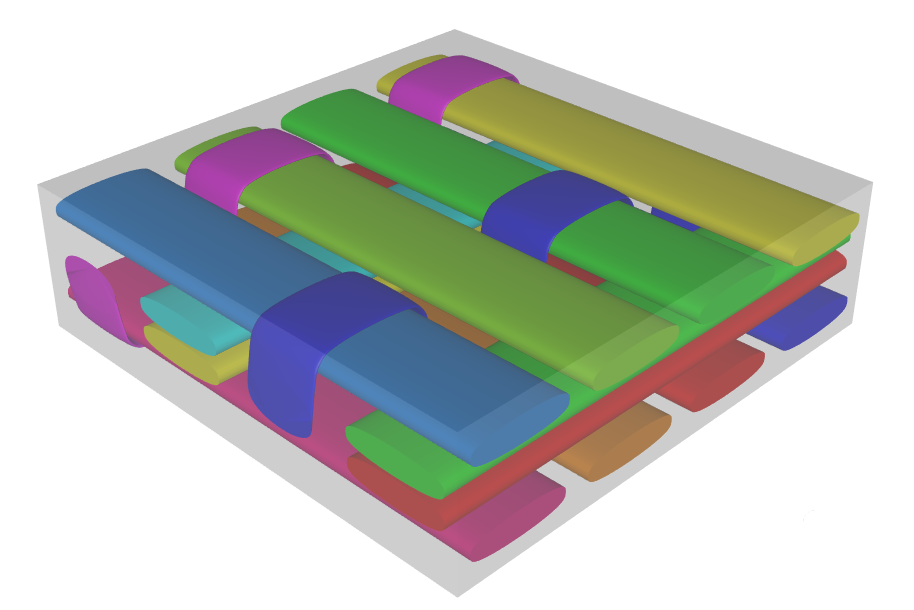
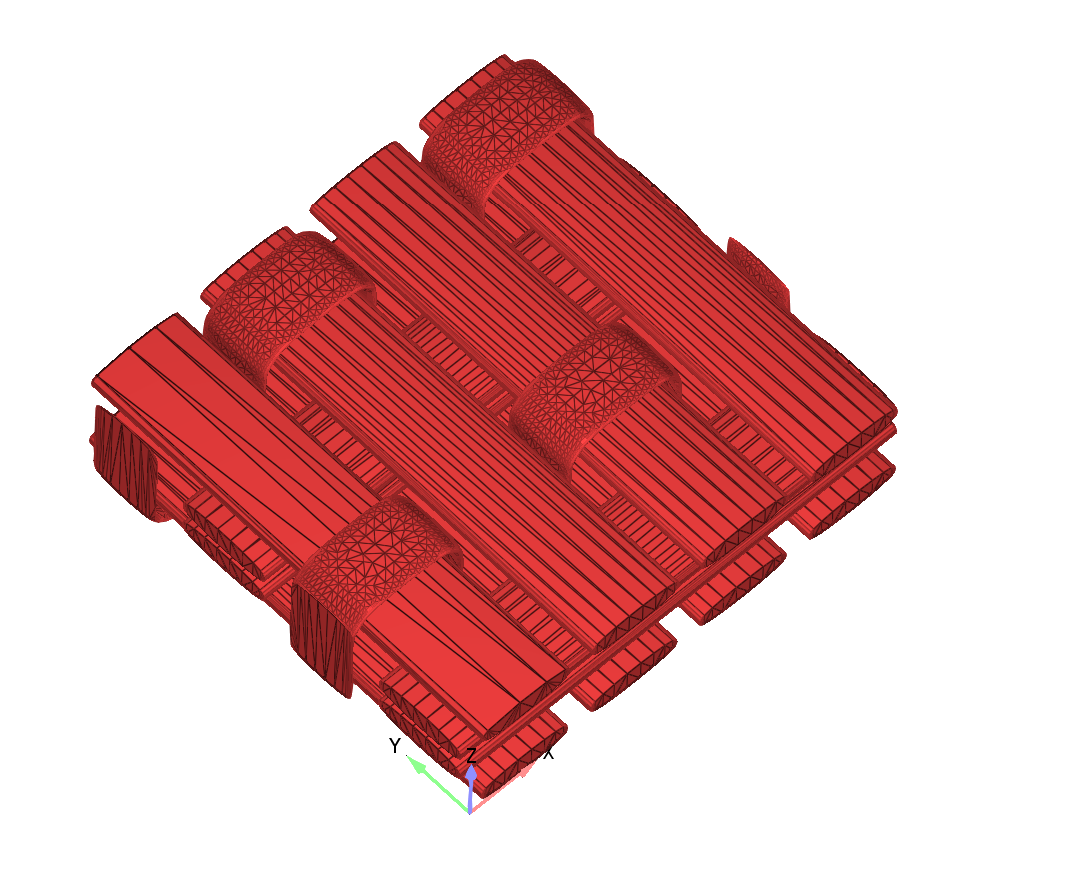
Simulation results
The weave produces non-uniform wet-out and preferential channel flow. Resin progresses through the larger inter-tow spaces while the porous tow interiors resist infiltration. The spatially uneven front identifies regions where a single uniform filling description would lose detail.
2.3 Macro scale: panel-level transport
Model setup
The macro model represents a 40 × 12 × 1 mm panel as a homogenized porous domain. It uses anisotropic Darcy permeability: 5 × 10⁻¹¹ m² in-plane and 1 × 10⁻¹² m² through the thickness. These are placeholder inputs for the demonstration; obtaining calibrated effective values from the lower scales remains part of the development work.
Simulation results
The original animation shows front propagation across the homogenized panel under the prescribed directional resistance. Individual fibers and local tow-scale gas pockets are outside the resolved geometry.
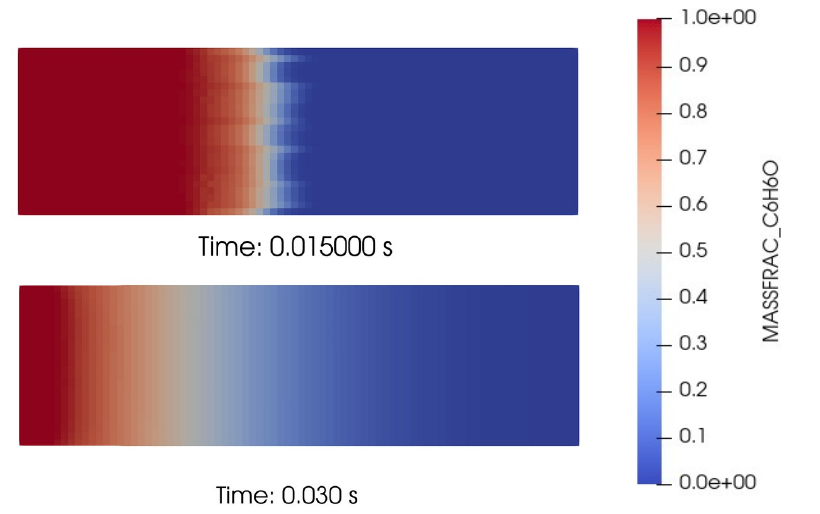
The model captures the overall transport response at this scale. A smooth front or absence of visible local voids cannot establish that the actual preform is void-free, because the relevant local geometry has been homogenized.
3. Cure-dependent material development
3.1 Material-subroutine formulation
The user-defined material subroutine described in Task 2 incorporates cure kinetics, thermal expansion, and chemical shrinkage. This formulation represents the evolution of material response during curing and was developed separately from the infusion simulations.
The broader Abaqus development aims to connect the evolving material response with gas generation and stress. At the January review, work was continuing on an empirical volatile/mass-loss relation, critical off-gassing pressure, void-growth rate, and the feasibility of coupled pore-fluid diffusion and stress analysis. These were development objectives; the review does not yet provide a validated coupled cure/defect prediction.
3.2 Earlier CFD heating formulation
The earlier CFD heating cases studied pre-gelation transport with temperature-dependent assumed fluid properties and simplified gas/heat source terms. That formulation did not calculate degree of cure or resolve reaction chemistry. Integration with the separate cure-dependent material subroutine remains a further development step.
Earlier heating and gas-transport studies
The early heating cases retained the micro- and meso-scale infusion geometries and added convective thermal boundaries. The macro heating case included a thin vent region above the porous structure, with convective side and bottom boundaries.
For those particular heating cases, local gas retention was observed near upper z-binder features in the meso model, while no obvious inter-fiber trapped voids were observed in the micro model. The micro-scale infusion sequence above is a different case and does show local gas entrapment. Each observation belongs to its own loading and model assumptions.
The pre-gelation formulation studied transport in a fixed domain. Bag deformation, preform compaction, and post-gelation residual stress were outside its scope.
4. Results summary and remaining validation
4.1 Documented results
The January 2026 review documents three infusion representations: explicit fiber wetting, flow through a woven architecture, and anisotropic porous-panel transport. The resolved simulations demonstrate local front retardation and gas entrapment between fibers, as well as preferential flow through inter-tow channels. The separate material-subroutine development incorporates cure kinetics, thermal expansion, and chemical shrinkage.
4.2 Calibration and validation priorities
Further work requires measured resin properties, calibrated directional permeability, and consistent transfer of effective properties between scales. Off-gassing relations and coupled stress behavior also require evaluation. Experimental comparisons are needed before these demonstrations support material-specific filling times, processing conditions, or defect predictions.
Source and research stage
The figures and animations are extracted from Multiphysics & Multiscale Modeling of TPS Infusion & Curing, the NASA SBIR Phase I Progress Meeting, January 5, 2026. Infusion work appears in slides 5–14; the curing development is summarized in slide 15. The review lists Purdue and AnalySwift as collaborators.
Original simulation images, color scales, and embedded videos are preserved. This page records the state documented in that review; later calibrated results and updated model outputs can extend the case study as they become available.